Running a Parallels Remote Application Server (RAS) farm in production means living with a constant question: how is the environment actually behaving right now? Sessions, gateways, brokers and agents all generate signals, but those signals are scattered, and turning them into a single, readable picture has never been straightforward. This is the problem the project described here sets out to solve.
The result is an open-source Azure Workbook for Parallels RAS, published on GitHub. It is a piece of work I designed and developed personally, and the motivation behind it is worth explaining before the what and the how.
Why I built this - the VIPP angle
I am a member of the Parallels VIPP (Very Important Parallels Person) program, a recognition that comes with a sense of responsibility I take seriously. Being part of that circle is not only about access and visibility: it is about giving something back to a product and a community I have worked with for years. Contributing to the growth of Parallels RAS - making it easier to adopt, operate and trust in real-world deployments - is, for me, the natural way to honor that role.
Monitoring is one of the areas where a focused contribution can make a tangible difference. Administrators who run RAS day to day need observability that fits naturally into the tooling they already use, and for the vast majority of organizations that tooling is Microsoft Azure. Bringing the two worlds together felt like the most useful thing I could build.
What the Workbook does
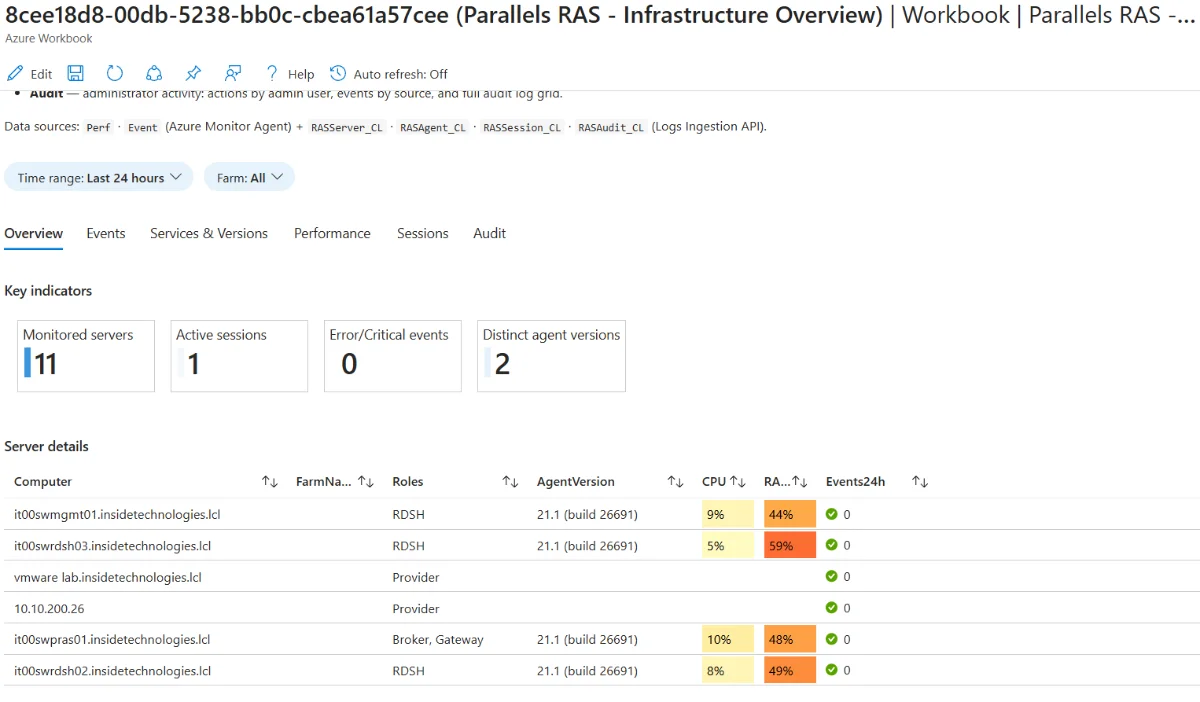
At its core, this project takes the operational data that a Parallels RAS farm produces and surfaces it inside Azure Monitor, the same place where teams already watch the rest of their infrastructure. Instead of jumping between consoles, an administrator opens a single Workbook and reads the health of the environment across six tabs, from a high-level overview down to session detail and administrative audit.
The information it brings together includes:
- Server and role inventory - which machines make up the farm and what role each one plays (Connection Broker, Secure Gateway, RDS Agent).
- Agent versions and state - a quick way to spot servers that are out of alignment.
- Active sessions - who is connected and how the user experience looks across the farm.
- Gateway capacity - connection volume over time, presented in a way that reflects real activity rather than raw cumulative numbers.
- Administrative audit - a record of RAS admin sessions for accountability.
The goal is deliberately simple: give the person responsible for the farm a clear, trustworthy view without forcing them to assemble it by hand.
How it fits into Azure, without the heavy lifting
One of the design principles was to make adoption as painless as possible for teams that already run RAS alongside Azure. The data reaches Azure Monitor through two complementary paths: standard Windows telemetry collected by the Azure Monitor Agent (AMA), and RAS-specific data gathered through the Parallels RAS API and sent into dedicated tables in Log Analytics.
What matters from a practical standpoint is the security model. The solution runs in a credential-free way, using the Azure Arc managed identity of the collector host. There are no passwords sitting in scripts or scheduled tasks; the RAS service credentials live in Azure Key Vault and are read at runtime. For anyone who has to defend a monitoring setup in a security review, this is a meaningful detail.
The entire package is delivered as Infrastructure as Code with Bicep, so the resources it needs are created consistently and can be reviewed before anything is applied. It is meant to be a reference implementation - something a team can take, read, adapt to their own naming and regions, and deploy with confidence.
The feedback that matters
I was glad to receive encouraging feedback from the Parallels side on the approach. The combination of standard Windows telemetry with a purpose-built RAS collector feeding custom Log Analytics tables, the credential-free operation built on Azure Arc managed identity, and the full IaC packaging were highlighted as a solid reference for customers running RAS with Azure Monitor today. Hearing that from the people closest to the product is exactly the kind of validation that makes a contribution like this feel worthwhile.
What comes next
This is a living project, not a finished one. There are some very interesting additions already in the works that will extend what the Workbook can show and make it even more useful for teams operating RAS at scale. I will share the details as they land - for now, it is enough to say that the roadmap is active and that the most engaging parts are still ahead.
If you run Parallels RAS and want a cleaner view of your farm inside Azure Monitor, the project is open and available to explore on GitHub. Feedback, issues and ideas are all welcome - they are, after all, what turns a personal contribution into something the whole community benefits from.
Conclusion
This Workbook started from a simple belief: a product I care about deserves better observability, and being part of the Parallels VIPP program gives me both the reason and the opportunity to provide it. Tools come and go, but the mindset of contributing back - of making something a little easier for the next administrator - is what keeps a community healthy. There is more to come, and I am looking forward to sharing it.
You can explore it at github.com/SilvioDB/azure-parallels-ras-workbook.
DBS