Questo articolo è disponibile anche in lingua italiana, al seguente link – Azure Arc: recuperare i performance counters su macchine Windows – WindowServer.it
After seeing, in this article Azure Arc: collect and manage custom logs from Event Viewer, how to retrieve custom logs from the Windows Server event viewer, it is time to see how to collect performance metrics from the servers in our infrastructure.
Why collect metrics in the cloud and not locally? Certainly, the size of the infrastructure is crucial in deciding which path to pursue, but it is also true that well-made software, like System Center Operations Manager, is rare; most of today’s solutions use SNMP traps, which cannot be considered advanced.
The adoption of Azure Arc, combined with a series of other elements, allows monitoring to be moved to the cloud, as is already done natively for virtual machines created on Azure.
Configuration
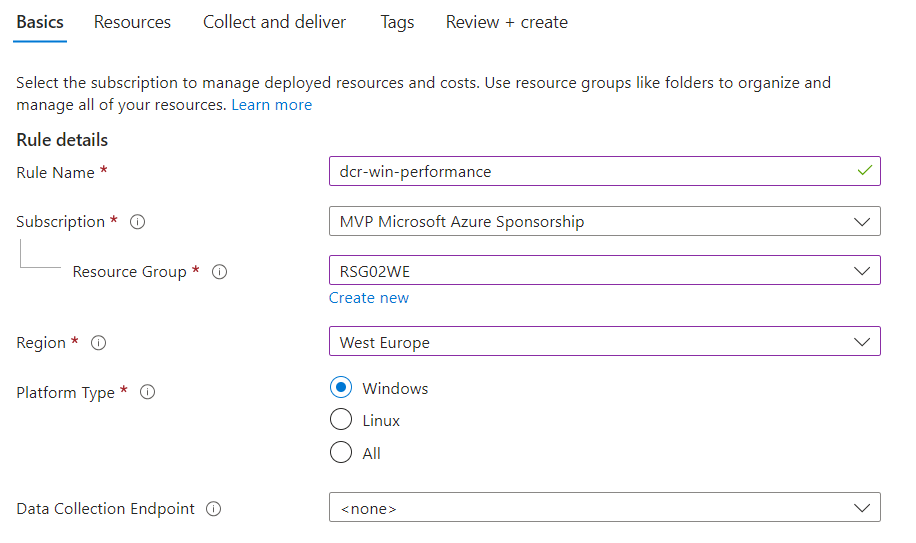
It almost goes without saying, but the first step, aside from installing the Azure Arc agent, is to create a Data Collection Rule (DCR), which will be used for performance scope.
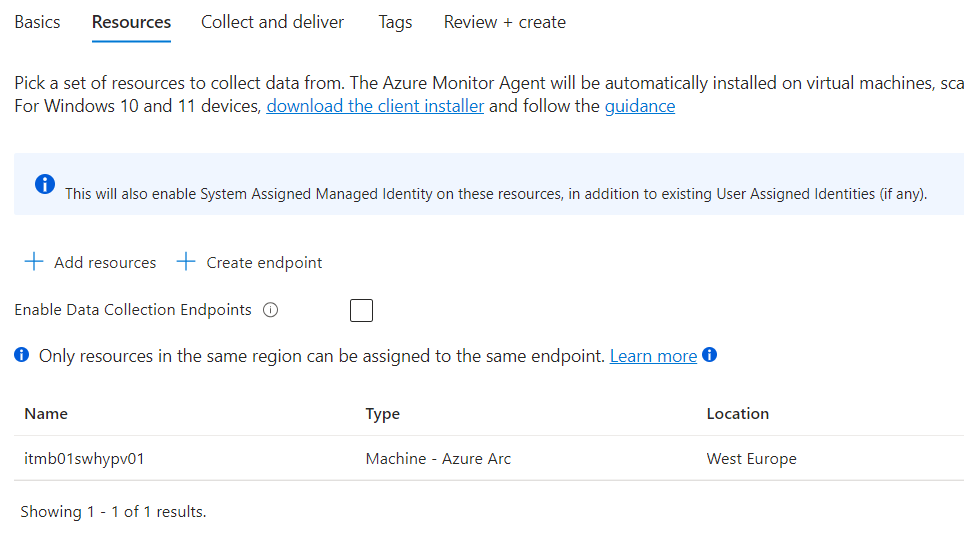
In the Resources section, select the servers for which you want to collect metrics.
Moving to the Collect and Deliver section, as the Data Source, select the Basic mode which will allow you to collect metrics on CPU, RAM, Disk, and Network.

NB: the Custom mode allows you to customize which specific metrics, such as SQL Server or other software that create their own dedicated counters.
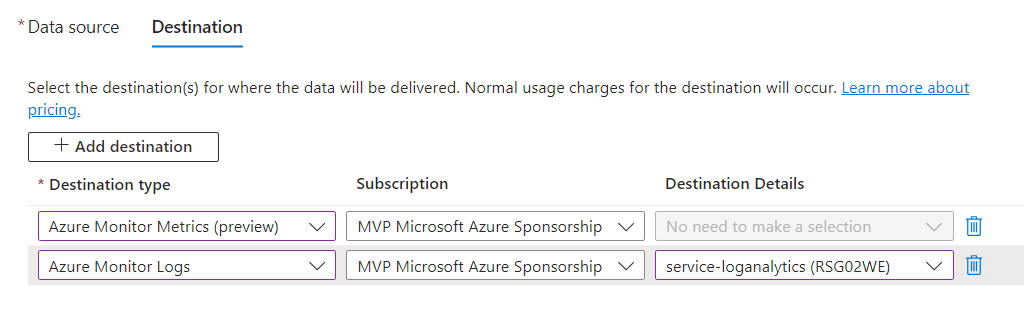
The last step is to assign the Destination, which involves using Azure Monitor Metrics, as well as Azure Monitor Logs, combined with Log Analytics to store the information in our workspace.
Query
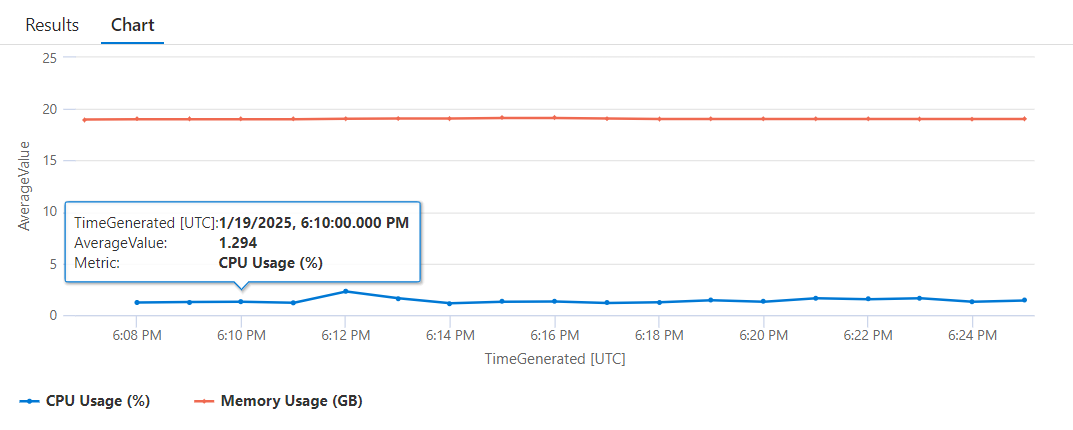
An example of a KQL query to check the CPU and RAM performance is as follows:
Perf
| where Computer contains “itmb01swhypv01”
| where (ObjectName == “Processor Information” and CounterName == “% Processor Time” and InstanceName == “_Total”)
or (ObjectName == “Memory” and CounterName == “Committed Bytes”)
| extend Metric = case(
ObjectName == “Processor Information” and CounterName == “% Processor Time”, “CPU Usage (%)”,
ObjectName == “Memory” and CounterName == “Committed Bytes”, “Memory Usage (GB)”,
“Other”
)
| extend CounterValue = case(
Metric == “Memory Usage (GB)”, CounterValue / pow(1024, 3), // Convert bytes to gigabytes
CounterValue // Keep CPU percentage as is
)
| summarize AverageValue = avg(CounterValue) by bin(TimeGenerated, 1m), Metric, Computer
| order by TimeGenerated asc
This result can be displayed in a Chart view, which will look like this.
To create a KQL query able of showing disk read and write usage, you can use this example:
Perf
| where Computer contains “itmb01swhypv01”
| where (ObjectName == “LogicalDisk” and CounterName == “Disk Read Bytes/sec”)
or (ObjectName == “LogicalDisk” and CounterName == “Disk Write Bytes/sec”)
| extend Metric = case(
CounterName == “Disk Read Bytes/sec”, “Disk Read (MB/sec)”,
CounterName == “Disk Write Bytes/sec”, “Disk Write (MB/sec)”,
“Other”
)
| extend CounterValue_MB = CounterValue / pow(1024, 2) // Convert bytes to megabytes
| summarize AverageValue = avg(CounterValue_MB) by bin(TimeGenerated, 1m), Metric, Computer
| order by TimeGenerated, Metric
Conclusions
The use of Azure Arc to monitor server performance is certainly very interesting, as it can be used to move this type of scenario to the cloud, both for the SMB world and for companies that want a second level of control or want to integrate Log Analytics logic.
#DBS