Questo articolo è disponibile anche in lingua italiana, al seguente link – Microsoft Sentinel: collegare ed analizzare i FortiGate – WindowServer.it
New appointment related to the Log Analytics world, where we will talk about how to retrieve logs from Fortinet firewalls to store administrative activities and monitor potential issues.
Before starting, it is necessary to have configured a Linux machine that handles log forwarding to Log Analytics. The steps for configuration are reported in the following article – Azure Arc: configure a Linux rsyslog to Log Analytics.
FortiGate Configuration
The integration involves two steps: enabling syslog and configuring what to send to syslog. The first step can be done both from CLI and UI, but with the first method, we can also specify the facility to use. The commands to launch within the console are as follows:
config log syslogd setting
set status enable
set port 514
set server “x.x.x.x”
set format cef
set facility local4
end
NB: clearly, the IP address of the server will be that of the Linux machine configured with Azure Arc.
The second configuration consists of indicating which logs to send, and this operation can be done from the Fortigate UI.
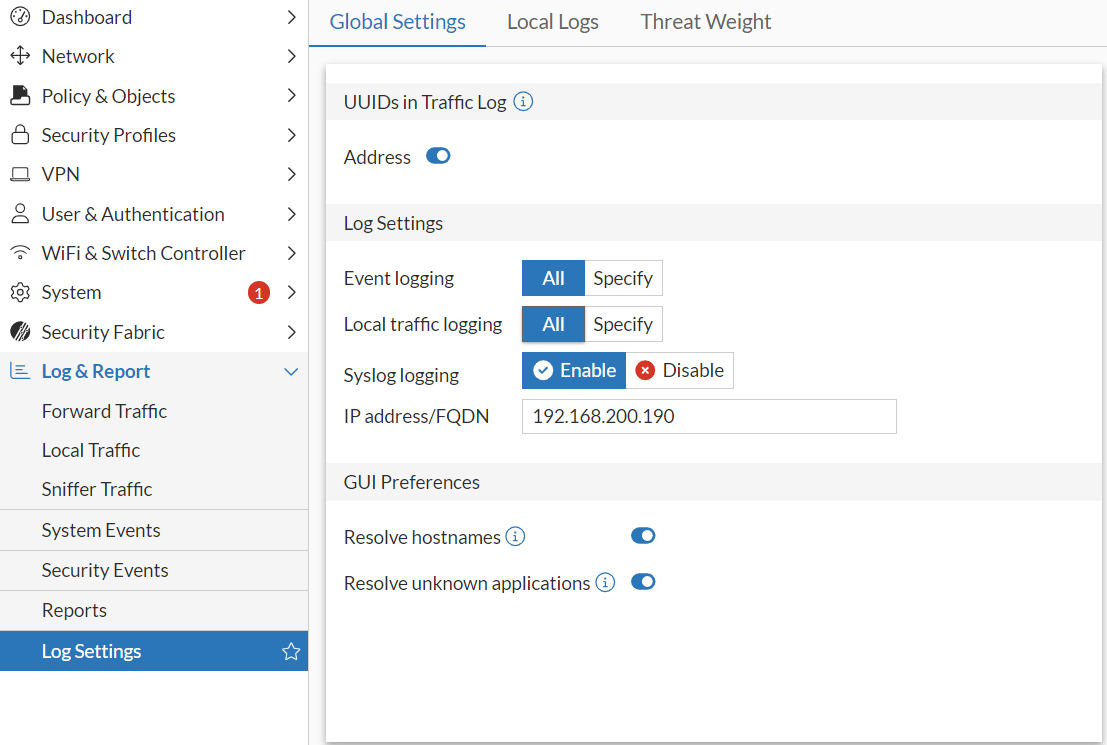
The advice I can give is not to enable traffic-related logs because we need to know if changes are made within the device or if particular activities occur, not what happens in the traffic – something already managed by the firewall itself.
At most, you could consider enabling inbound logs for a short period to see if someone tries to attack you, but even in this case, it is better to delegate the task to the firewall interface.
Test in Log Analytics
If you have correctly followed the previous article and maybe already activated a syslog for another purpose, you will only need to activate the LOG_USER4 facility – or the one used in the previous point – within the Data Collection Rule to activate the capture of new logs.
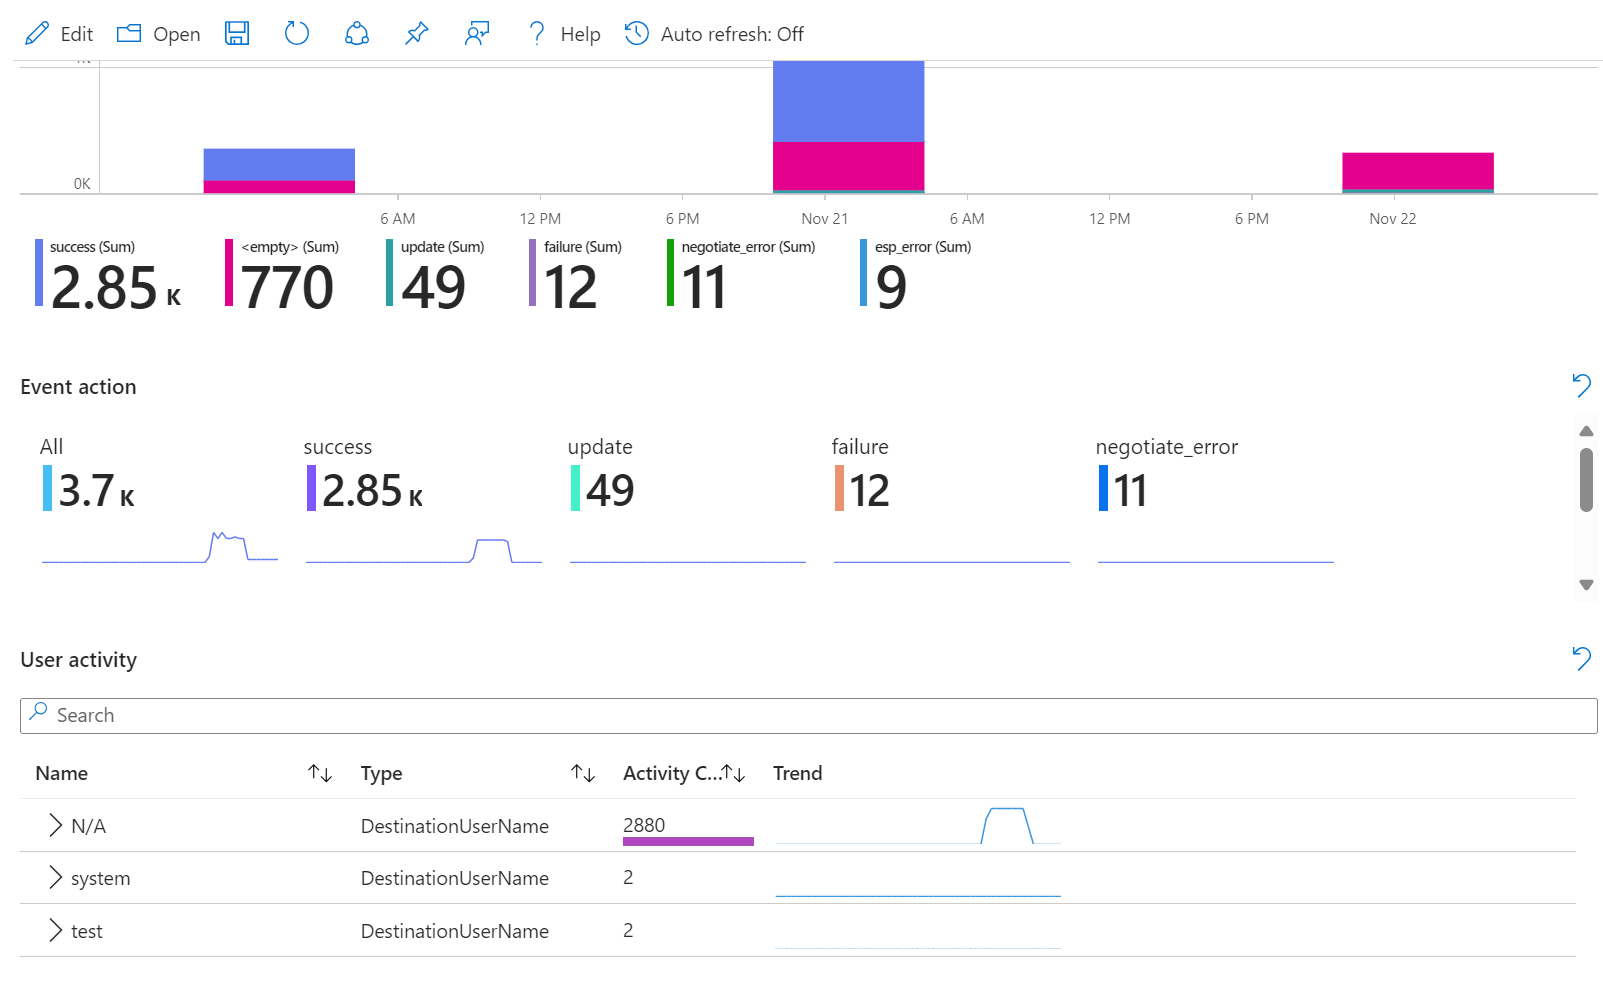
At this point, you could already test to verify if your device is correctly sending the logs through a KQL query like this: Syslog | where Computer contains “fw01” | project EventTime, SeverityLevel, SyslogMessage, ProcessName where in the Computer value, you need to insert the name of your firewall.
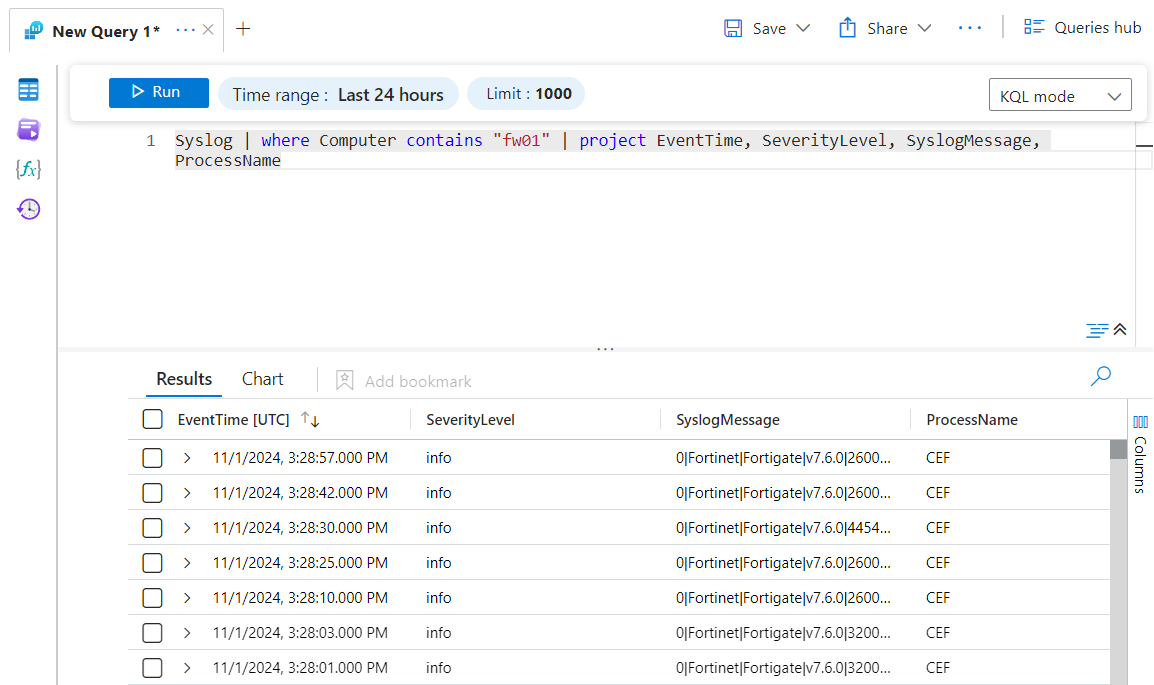
As you can see, the Message column appears a bit confusing, while the ProcessName is CEF, even though we are calling a query via Syslog. This happens because the log saving format is indeed standard CEF, so it is necessary to normalize the data before ingestion.
Integration with Microsoft Sentinel
To perform this normalization, it is necessary to use one of the solutions present within Microsoft Sentinel. This solution is found within the Content Hub and is named Common Event Format via AMA, which also requires a dedicated configuration of a different Data Collection Rule, specific for this purpose.
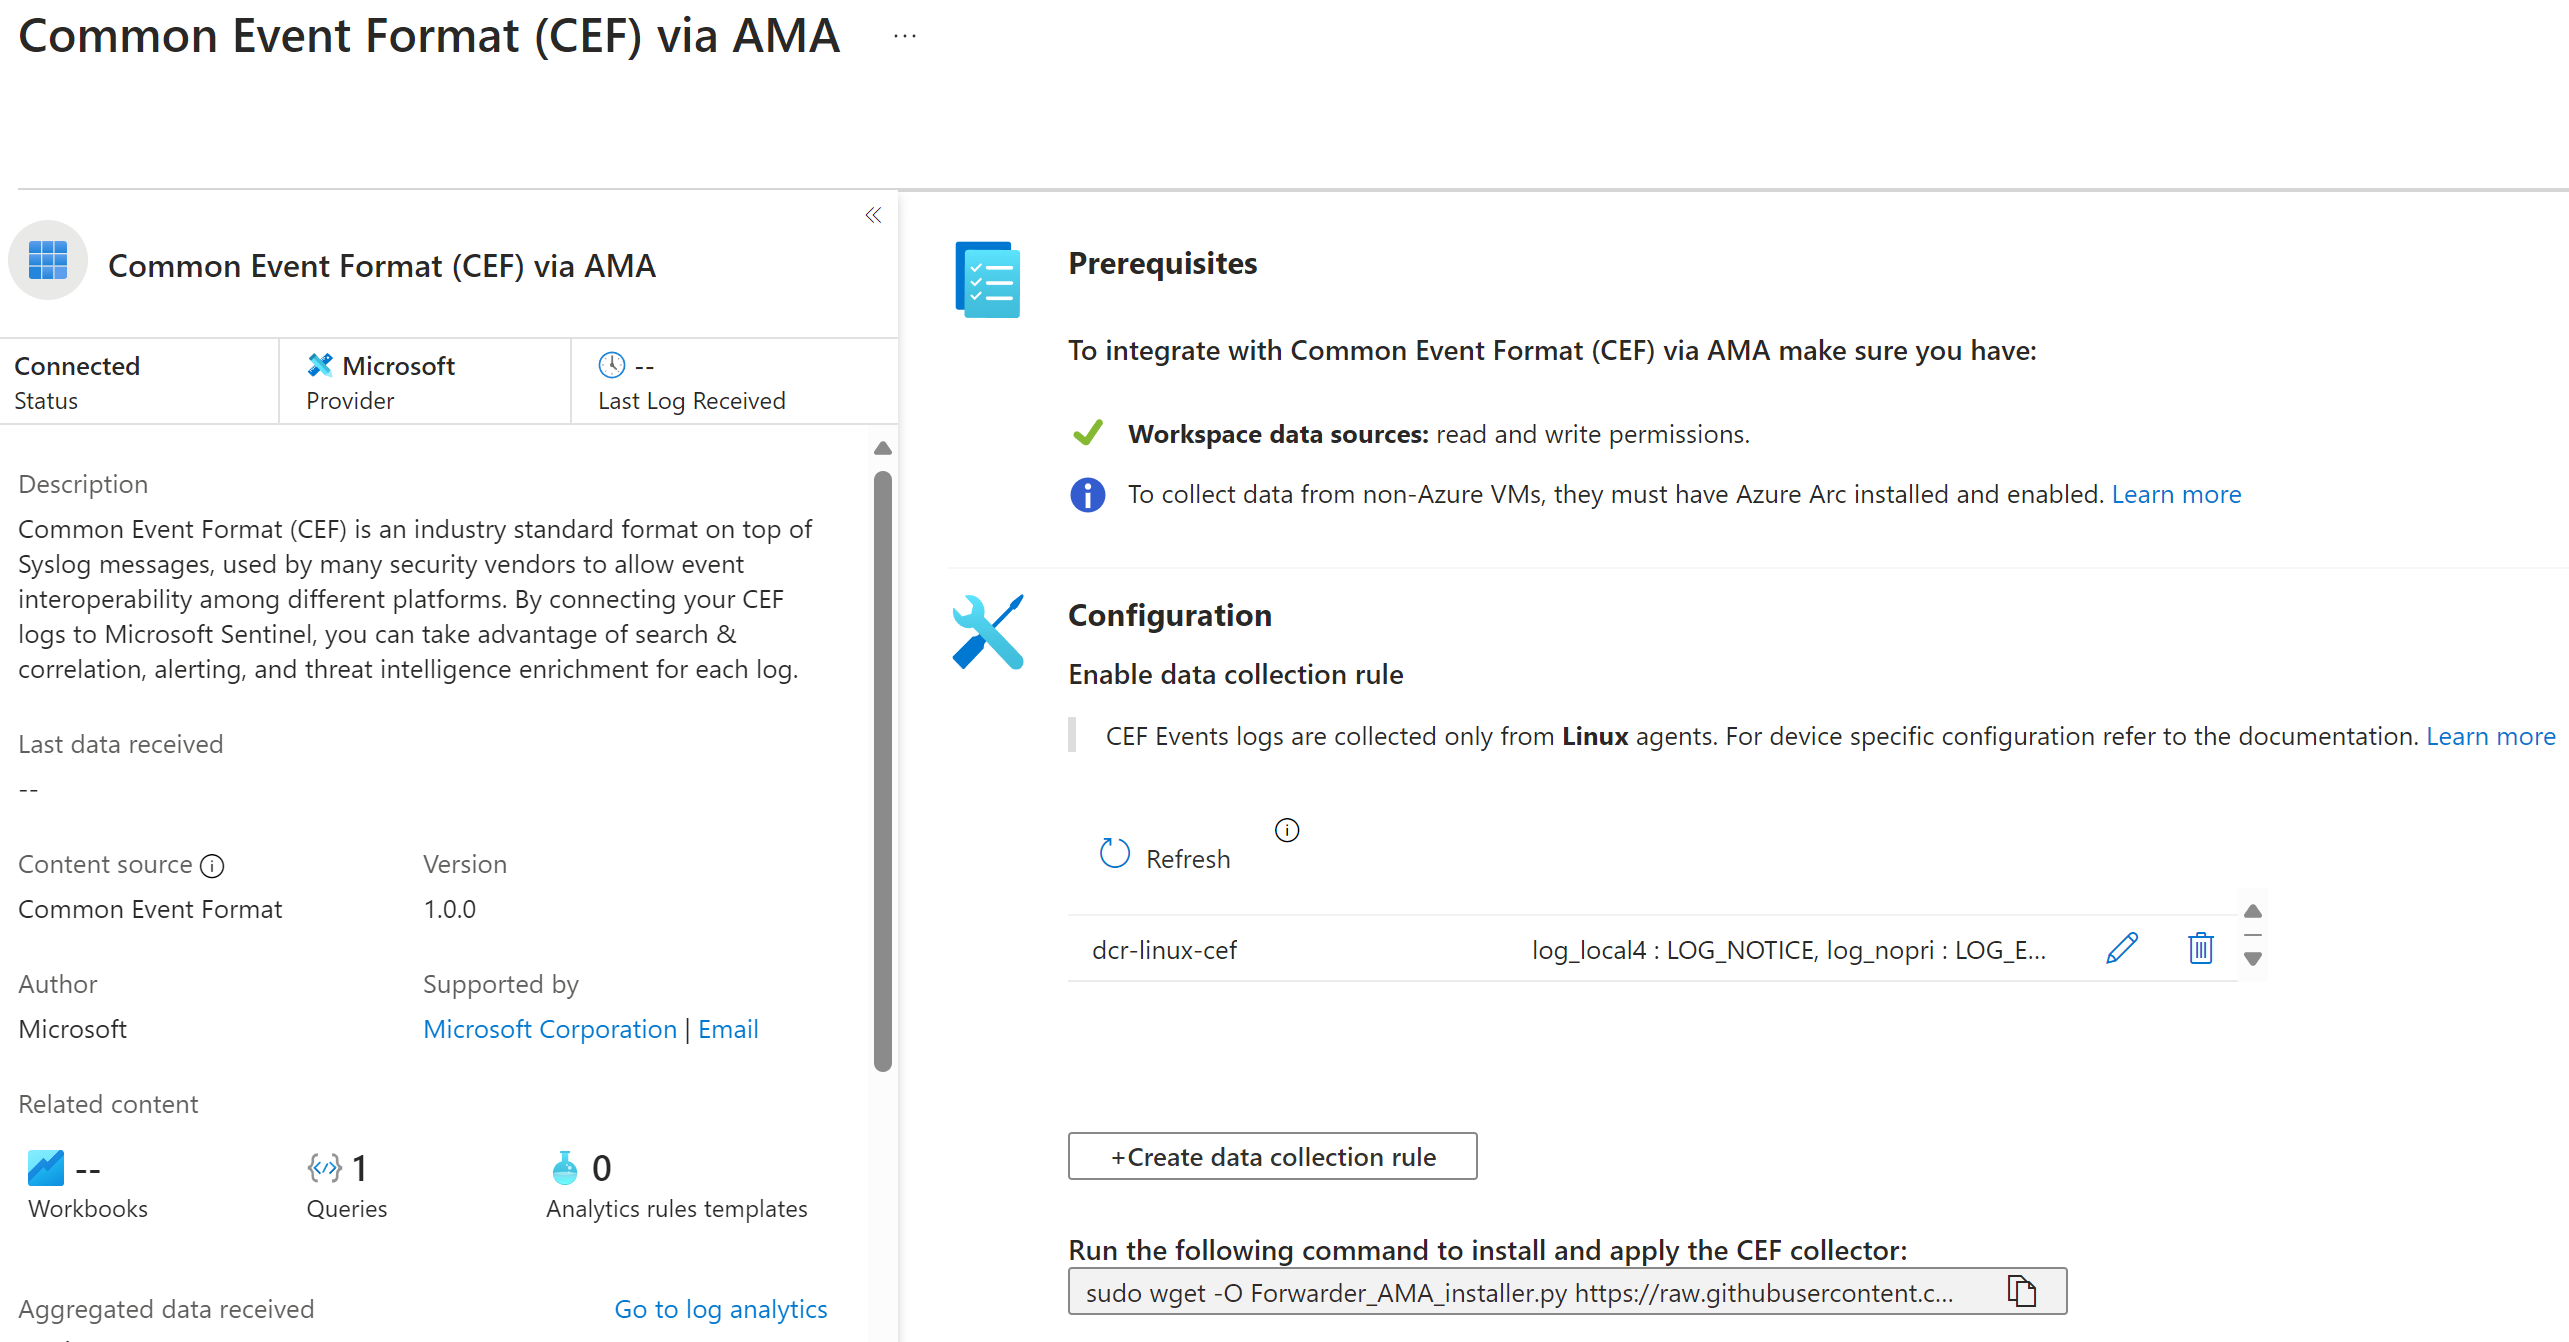
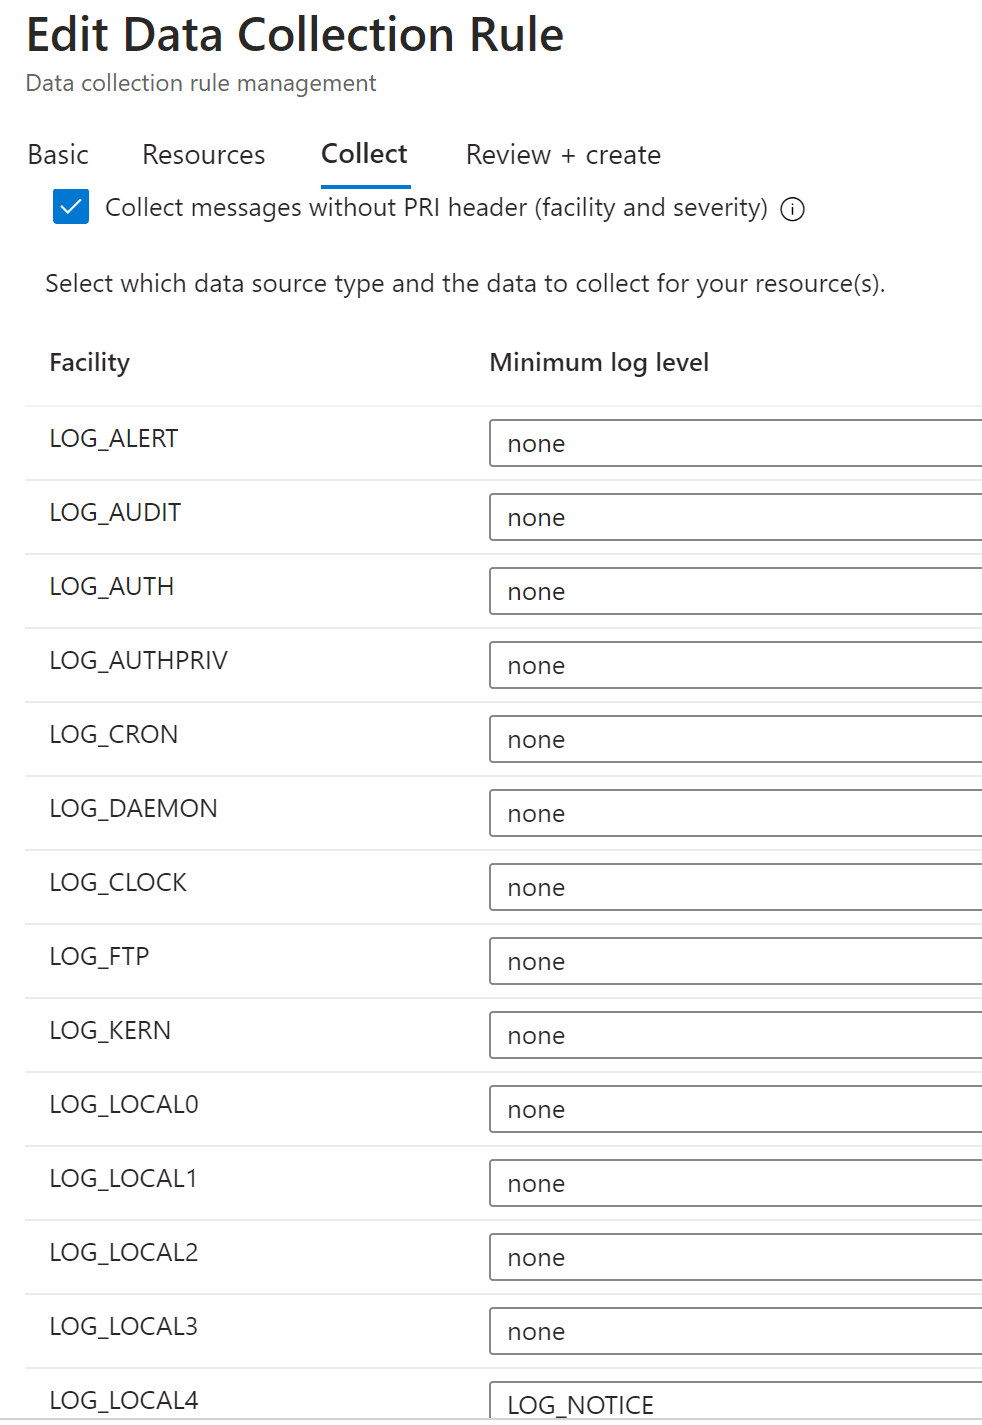
As you can see from the image, the facilities to choose are the same ones configured within the various network devices (LOG_LOCAL4 in our case).
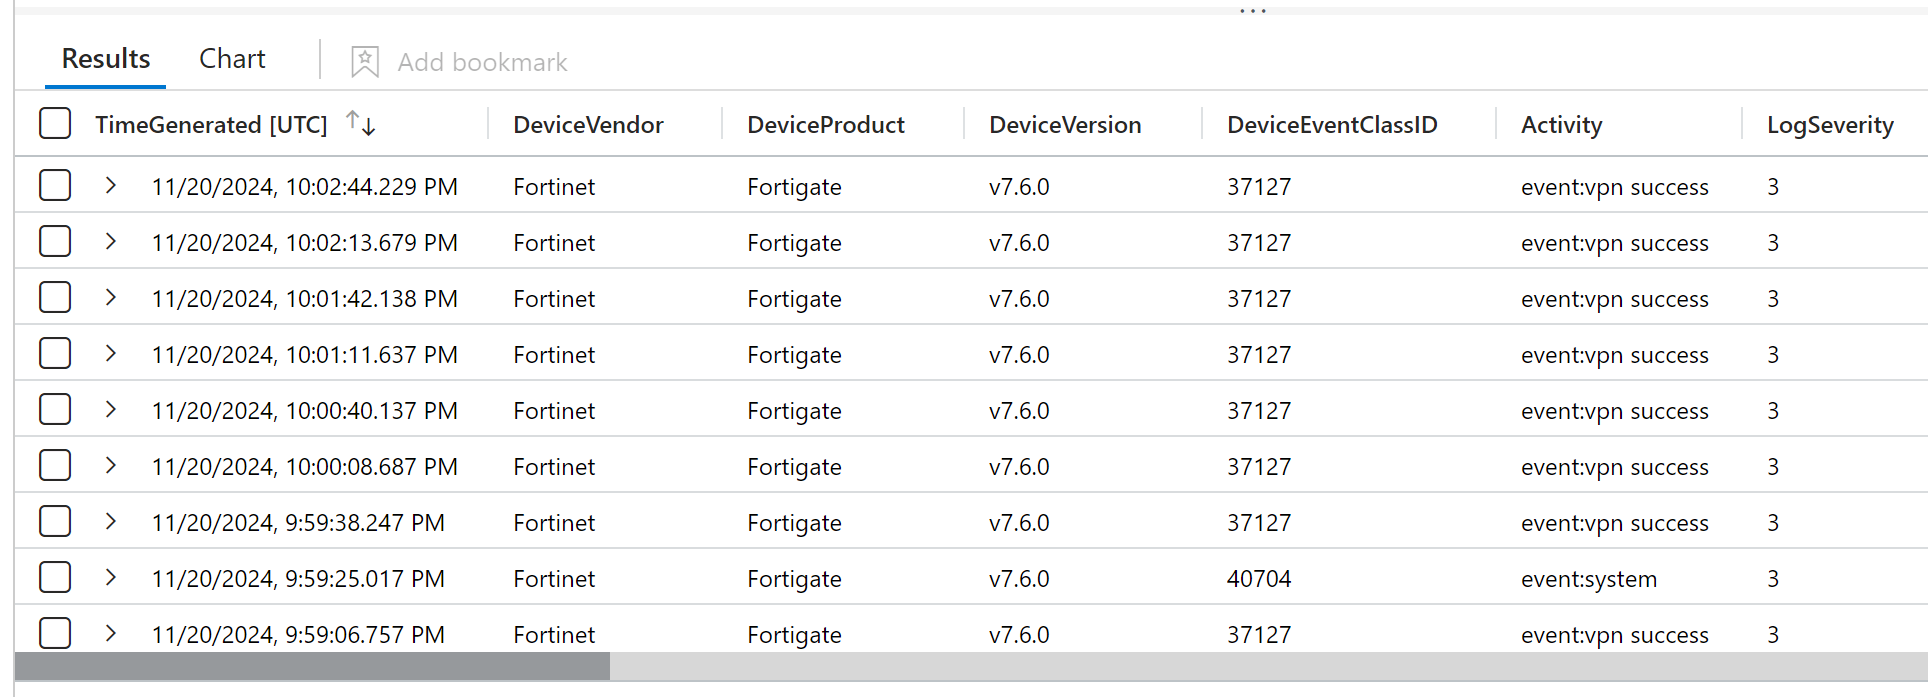
Once the procedure is completed, it will be possible to launch the following KQL query – CommonSecurityLog – to get a result like the following.
Fortinet Solution
The advantage of Microsoft Sentinel is to provide not only detection rules to proactively notify dangers or abnormal behaviors but also to make available Azure Workbooks containing useful information to understand what is happening. Regarding Fortinet, there is a solution within the Content Hub.
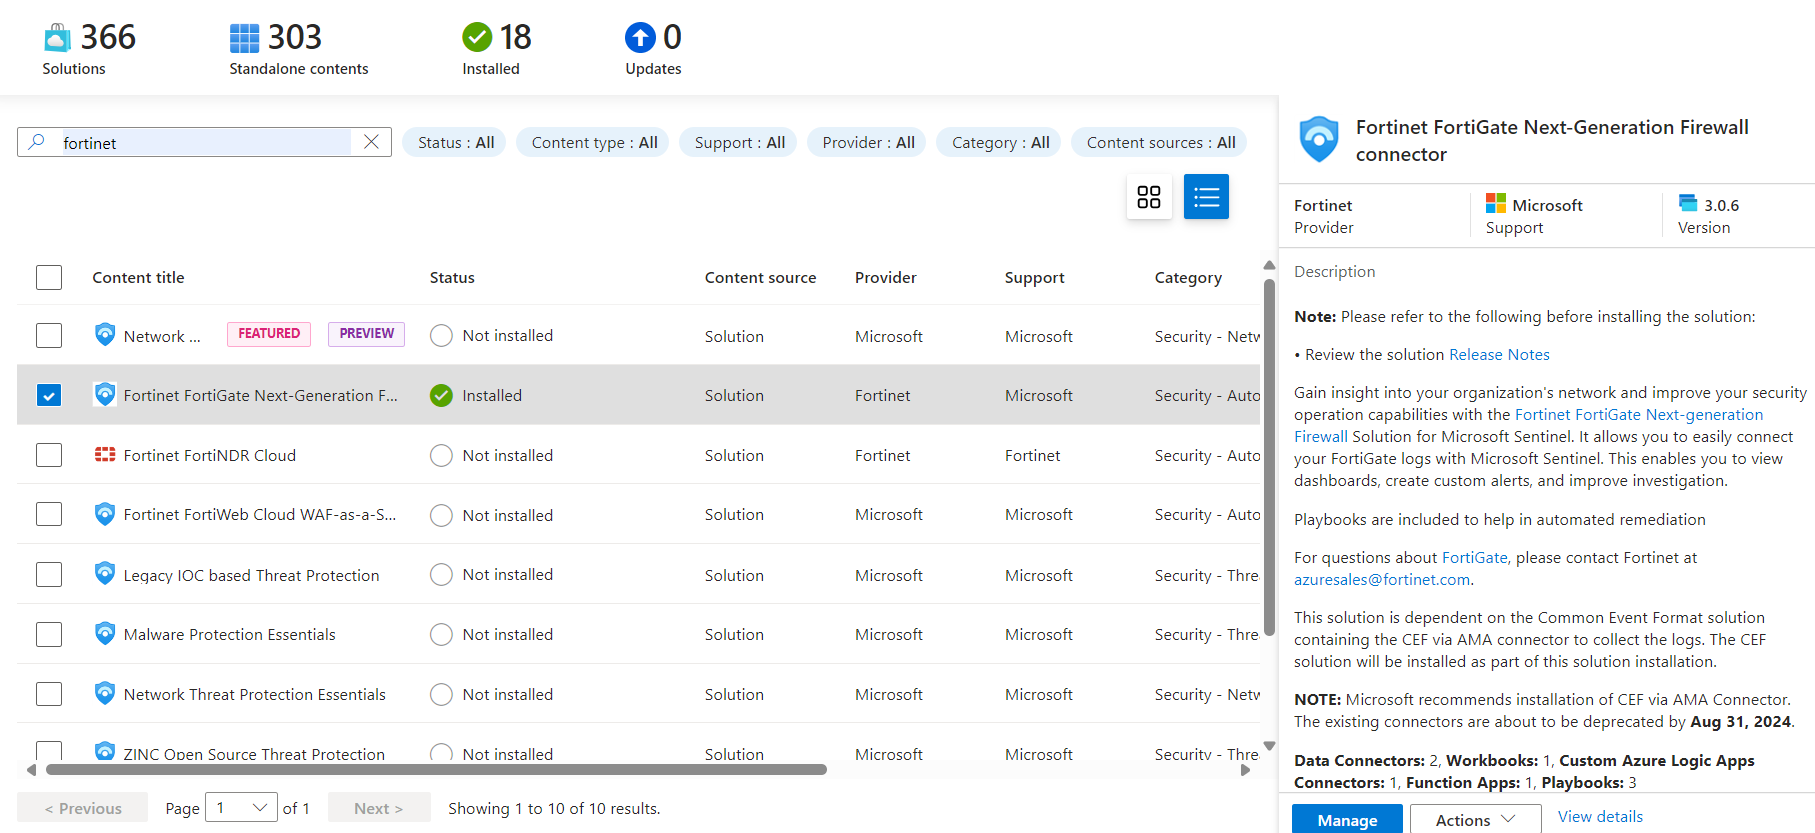
Within the solution, there are two deprecated Data Connectors, named Fortinet via AMA and Legacy Agent, because they have been replaced by the more standard Common Event File via AMA.
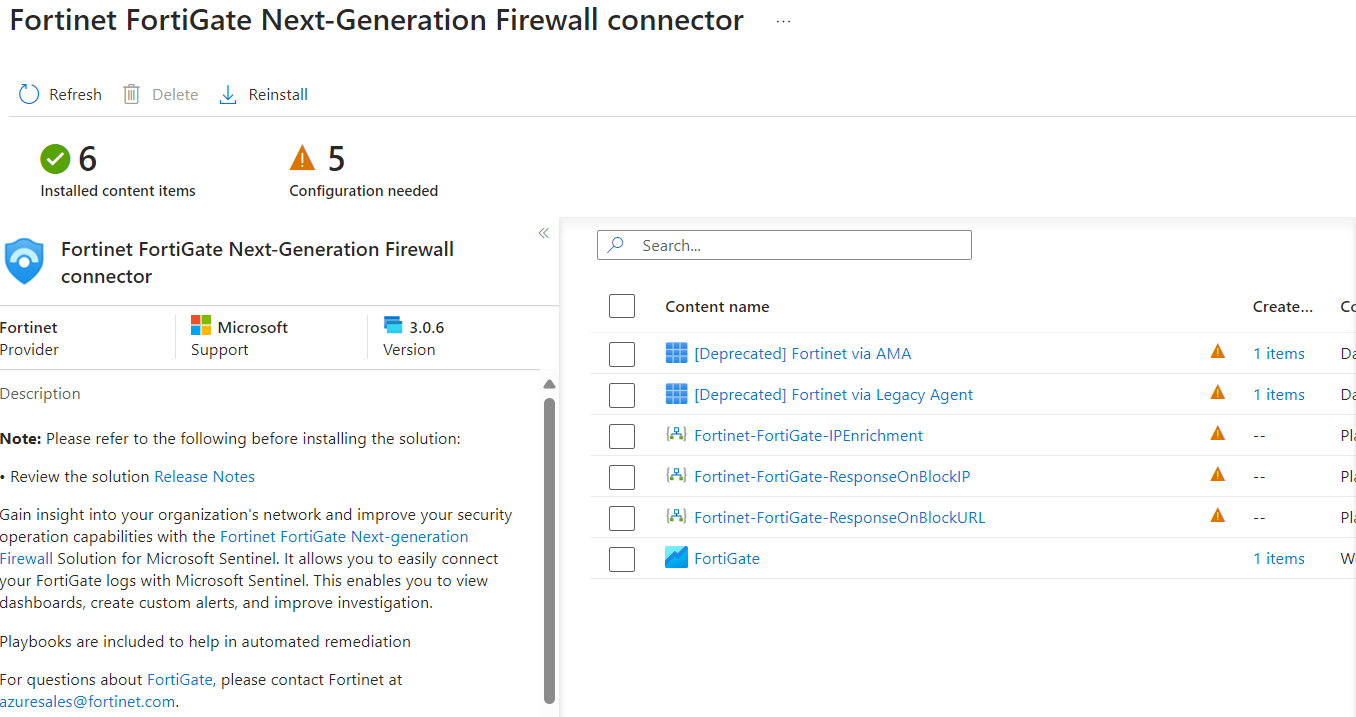
As you can see from the image, the solution also contains Playbooks that can perform various operations.
Azure Workbook
Included in the Fortinet solution, we also find an Azure Workbook that offers a series of necessary information to understand what is happening to our firewall.
Performance Monitoring
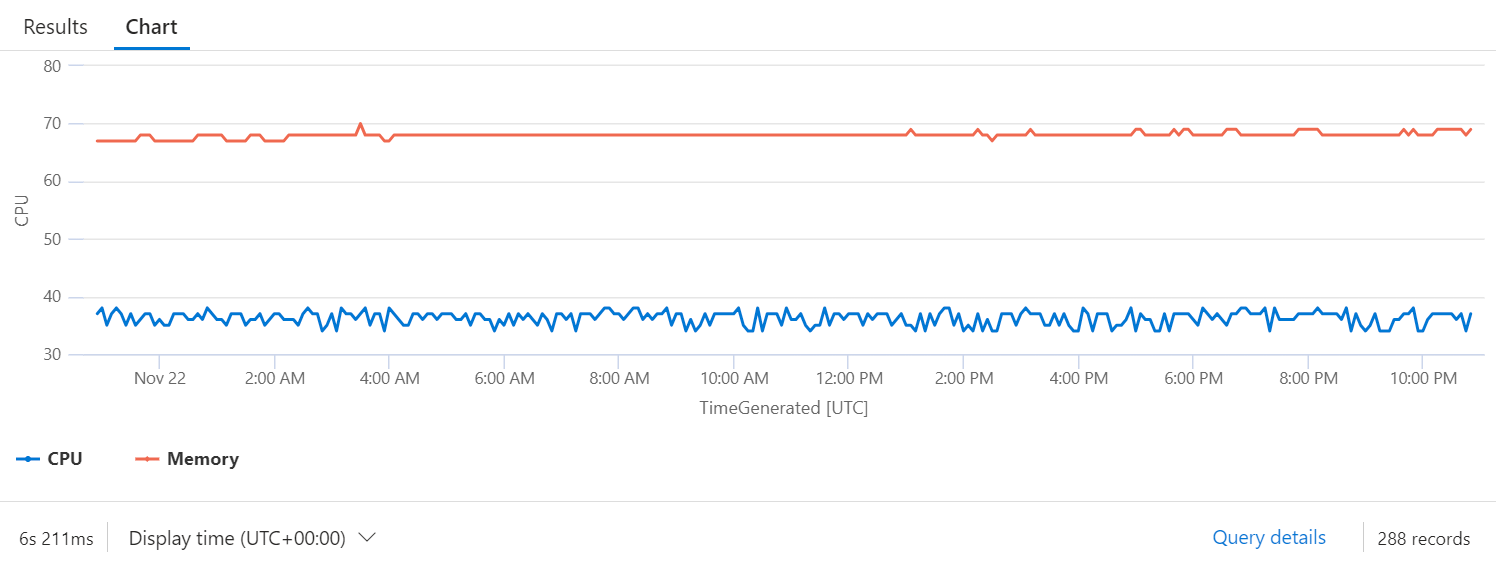
One of the most interesting things offered by this integration is that the firewall also returns some information on resource usage, such as CPU and RAM. These values, however, are found in the Message column and need to be extracted; the query useful for this purpose is as follows:
CommonSecurityLog | where Computer contains “fw01” | where DeviceEventClassID contains “40704” | extend CPU = toint(extract(“average CPU: (\d+)”, 1, Message)) | extend Memory = toint(extract(“memory:\s+(\d+)”, 1, Message)) | project TimeGenerated, CPU, Memory | render timechart
Conclusions
The integration of various devices with Microsoft Log Analytics and Microsoft Sentinel allows not only to have a status on the activities carried out and prevent attacks or dangerous operations but also to have useful information to understand performance – important to know if our devices are under stress or not performing correctly.
#DBS