Questo articolo è disponibile anche in lingua italiana al seguente link: Azure Arc: attivare la raccolta dei log di accesso da Active Directory – WindowServer.it
In a previous article – How to collect and manage audit log with Azure Arc and Microsoft Sentinel – we saw how to activate log capture via Azure Arc. Today we will go into a little more detail, seeing how we can correctly analyze the access logs coming from the Domain Controllers.
Before you can get started, you must have already done the following:
- Install Azure Arc on Domain Controller
- Create a Data Rule Collections linked to the servers in question and capable of recovering the Security Logs (Success and Failure)
- Enable logs on Domain Controllers – How to enable Audit Active Directory objects – Windows Server | Microsoft Learn
Analyses
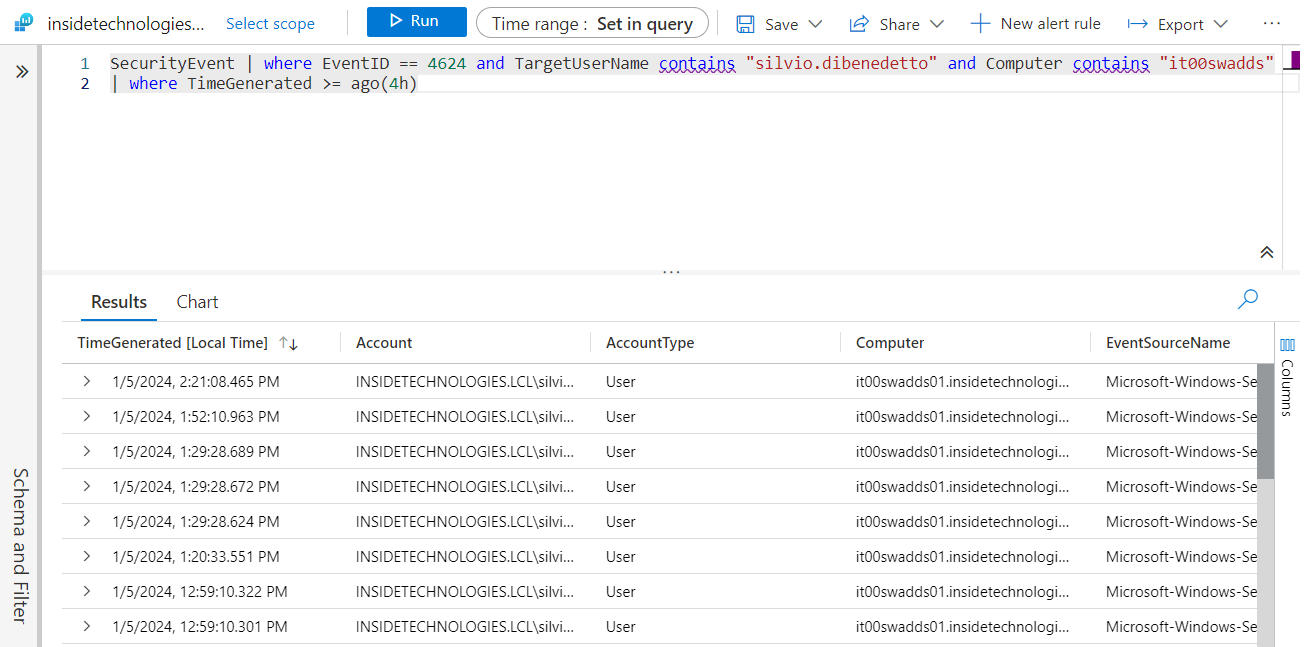
After few hours since the activation of the DCR, it will be possible to execute queries such as the following: SecurityEvent | where EventID == 4624 and TargetUserName contains “silvio.dibenedetto” and Computer contains “it00swadds” | where TimeGenerated >= ago(4h)
Remember to modify the TargetUserName variable with the user you want to search for and the Computer variable with the naming convention that contains your Domain Controllers, so as to filter only the necessary accesses.
How can I see only the columns that interest me? After running your query, you can use the Project command to choose the columns you want to display. For example you can use this query: SecurityEvent | where EventID == 4624 and Computer contains “it00swadds” | where TimeGenerated >= ago(5h) | project TimeGenerated, TargetUserName, EventID, IpAddress, LogonTypeName
Advanced Security Information Model
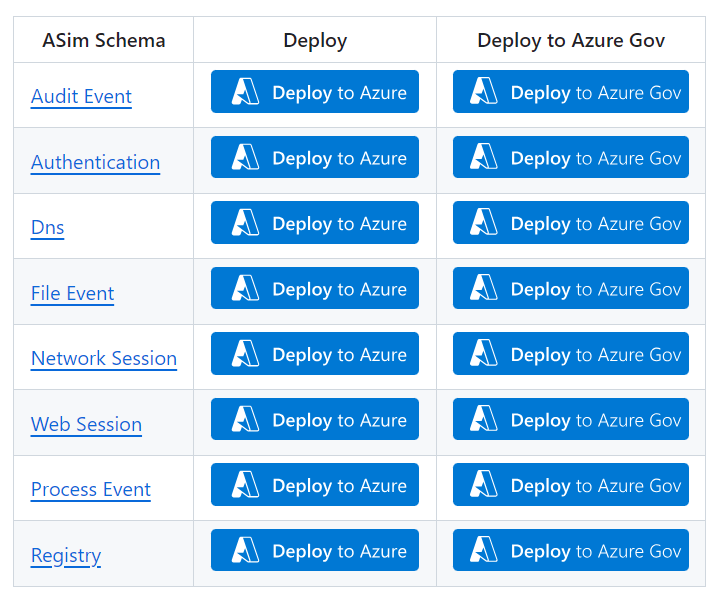
This is the first way to analyze the data. There is a second one that uses the Advanced Security Information Model, that is a “normalizers” of the saved logs and which allow queries to be made in another way, sometimes having a clearer view, as well as being able to cross-reference sources. These templates are available at the following link – Azure-Sentinel/ASIM at master · Azure/Azure-Sentinel · GitHub.
The templates, in addition to a new query syntax, integrate ready-made Azure Workbooks, which help to carry out the desired analyses. In this case, the scheme is called Authentication, while the workbook is called Identity & Access.
Another advantage of these normalizers is the possibility of querying multiple sources easily. An example is given by this query: imAuthentication(targetusername_has=’silvio.dibenedetto’, starttime = ago(5h), endtime=now()) – where the SecurityEvent logs are merged with Defender for Endpoint logs.

I like a query but I want to modify it with some information, what I can do? By editing the workbook it is possible to modify the various areas displayed to be able to copy the code.
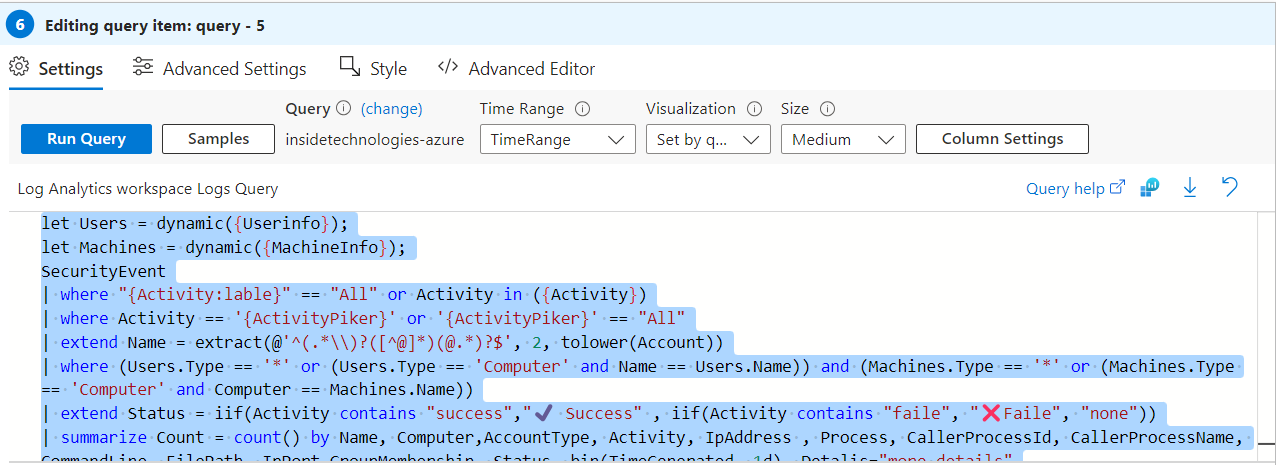
The query is made in Kusto Query Language, where you can see the integration between the various classes but above all the aesthetic modification, and merges the logs coming from the Security part and those from Defender for Endpoint. If you want to learn more about the use of KQLs, you can read this article – Azure Monitor workbook grid visualizations – Azure Monitor | Microsoft Learn.
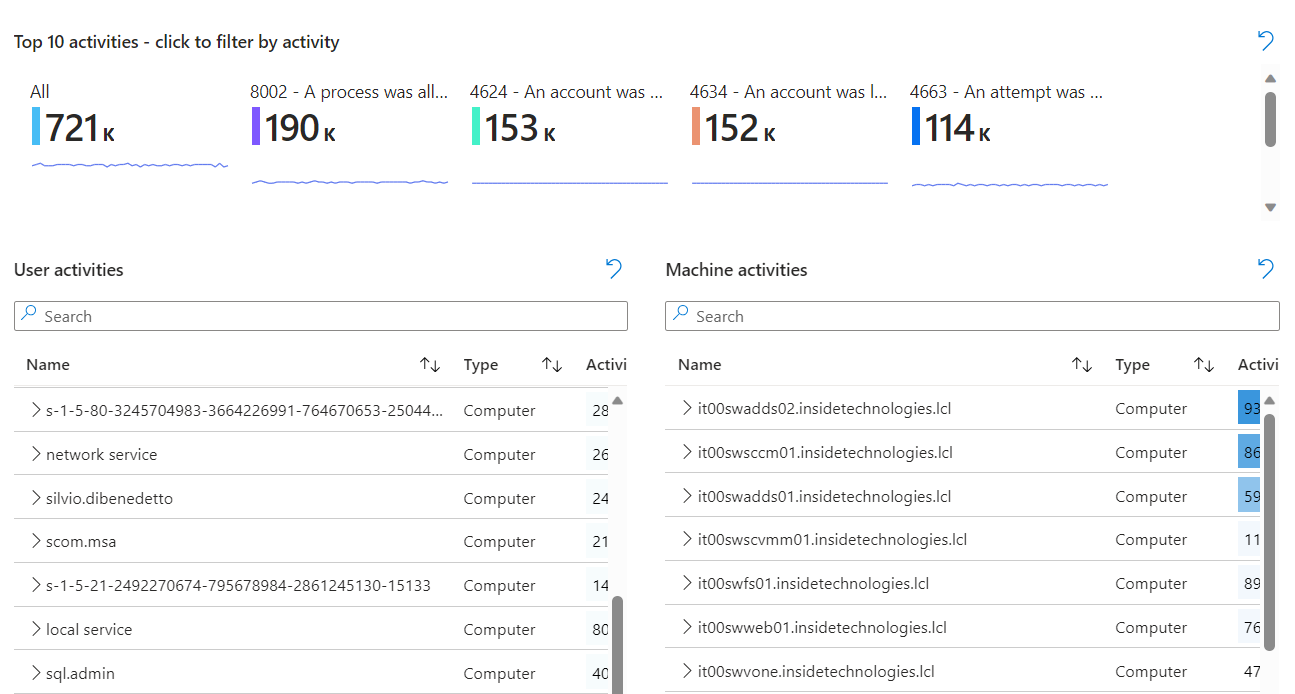
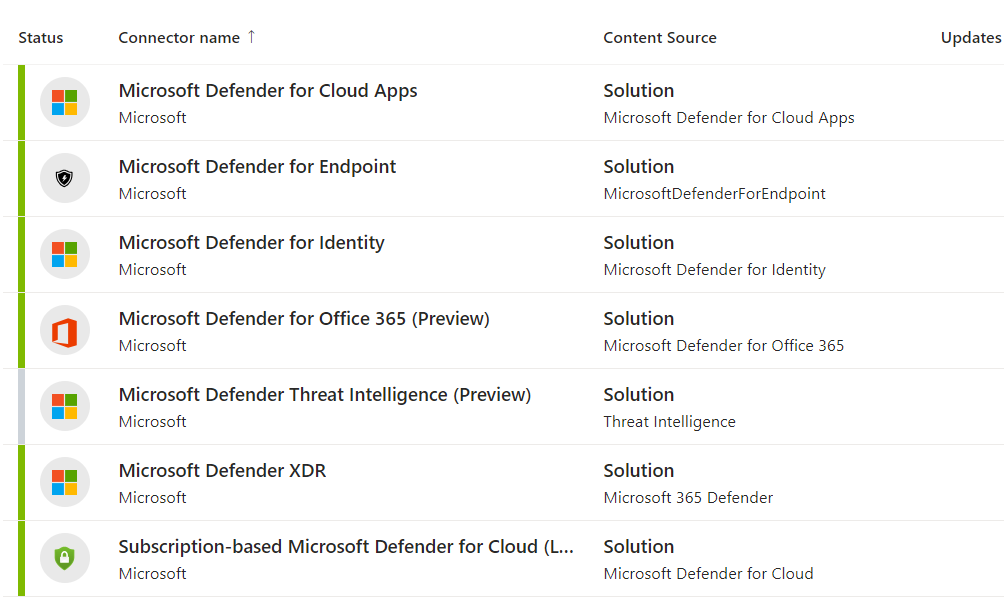
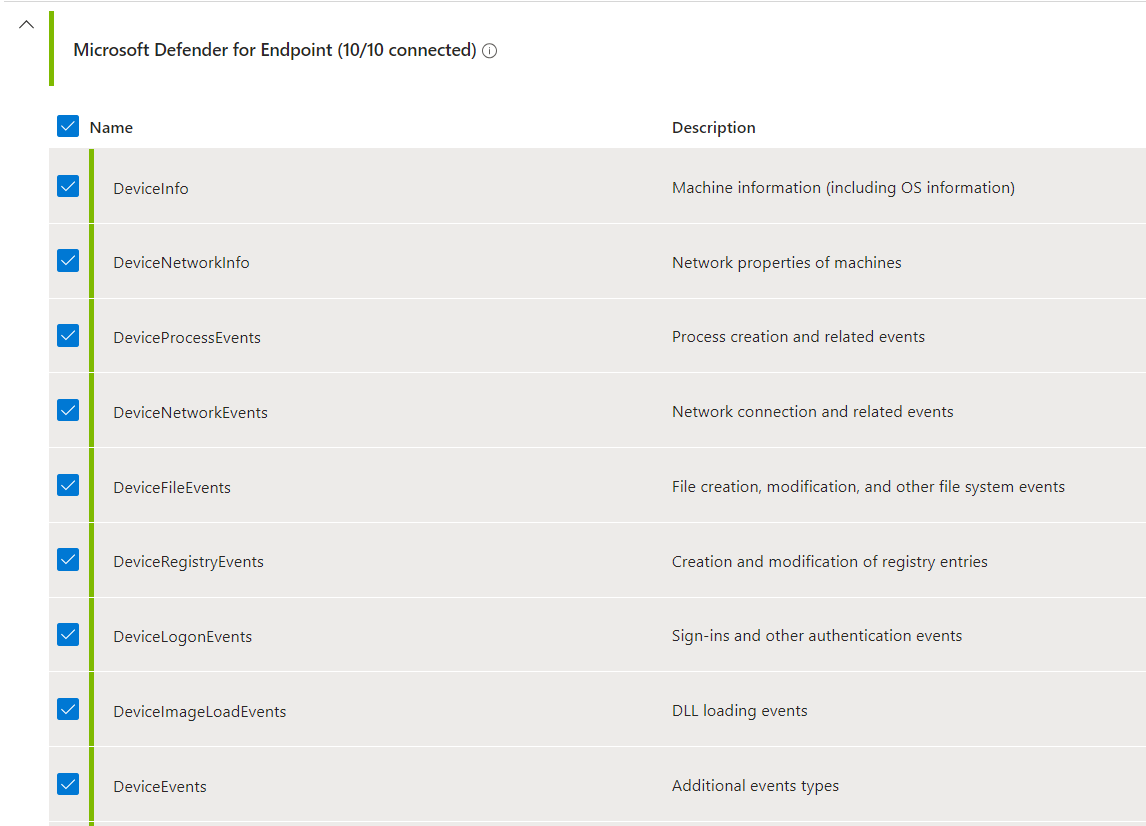
Integration with Microsoft Defender for Endpoint
Not everyone knows that the integration between Microsoft Defender for Endpoint and Microsoft Sentinel also brings access logs, and more, as shown in the previous image. This offers even more functionality when analyzing. To activate the integration it is necessary to configure the Microsoft Defender XDR Data Connectors, choosing the connectors responsible for controlling the DeviceLogonEvents.
Note: this operation may increase the number of logs acquired and therefore the cost of the Log Analytics Workspace.
Run this query to check how it works: imAuthentication(targetusername_has=’silvio.dibenedetto’, starttime = ago(6h), endtime=now()) | where EventProduct contains “M365” and EventOriginalType_string == “RemoteInteractive”
In this case we are using the normalizer to execute a query, retrieving the events generated by the “M365 Defender for EndPoint” product; in detail, the query retrieves a remote logon, given that the user in question is trying to access a VM via Azure Virtual Desktop – therefore in RDP.
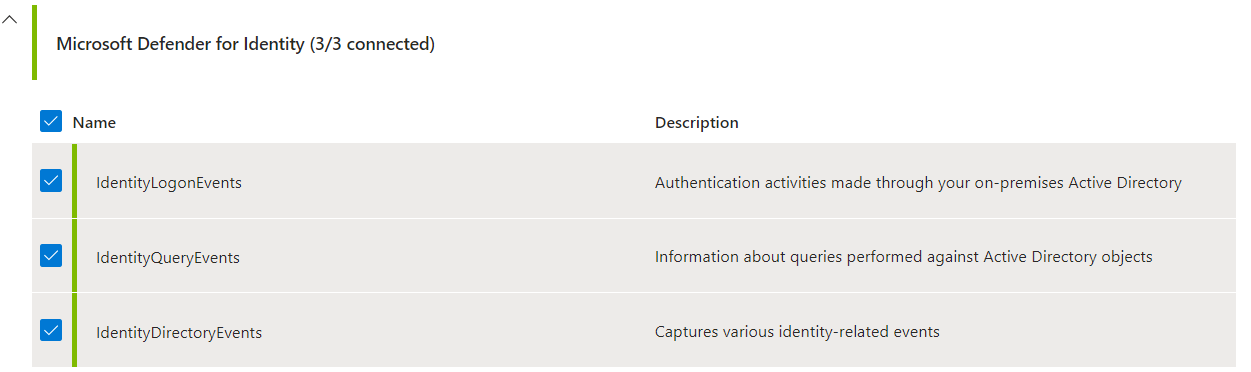
Integration with Microsoft Defender for Identity
It certainly doesn’t end here! The integration can also be extended to Microsoft Defender for Identity to have not only access logs, but also the activities carried out within Active Directory, such as the creation of a user or a group, to give some quick examples. Also in this case, the activation passes through Microsoft Sentinel, as well as for MDE, to which is added the activation of User and Entity Behavior Analytics.
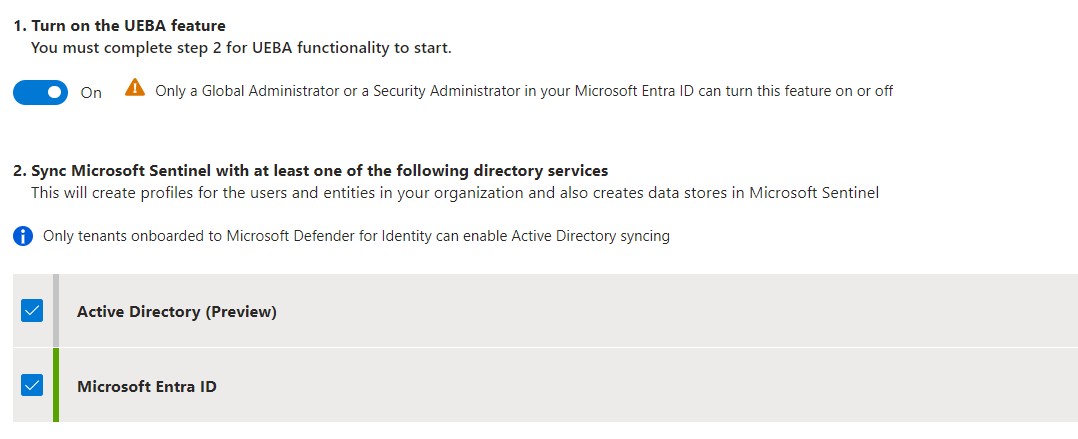
Why UEBA? Because Microsoft Sentinel collects logs and alerts from all connected data sources, using a wide range of machine learning techniques and capabilities, it analyzes them and creates basic behavioral profiles of entities in your organization (such as users, hosts, IP addresses, and applications ) over the time and horizon of the peer group. If you are interested in learning more about the topic, here is a link to the article – Identify advanced threats with User and Entity Behavior Analytics (UEBA) in Microsoft Sentinel | Microsoft Learn.
A useful query for analysis could be to understand the change in group membership, which is useful for monitoring lateral movement: IdentityDirectoryEvents | where ActionType == “Group Membership changed” | extend ToGroup = tostring(AdditionalFields.[“TO.GROUP”]) | extend FromGroup = tostring(AdditionalFields.[“FROM.GROUP”]) | project TimeGenerated, Actor=AccountName, UserAdded=TargetAccountUpn, ToGroup, FromGroup
Conclusions
Azure Arc, integrated with Microsoft Defender XDR, is certainly the ideal solution for monitoring user activities within Active Directory. The advanced use of KQL helps IT Admins to monitor all the operations performed by users but also by those who have particular privileges within AD.